The Tumor Microenvironment transcriptomic Atlas (TMEAtlas)
TMEAtlas is an interactive computational tool from the Longaker Lab that allows users to independently interrogate pan-cancer tumor microenvironment cell atlas data to advance their own research projects.
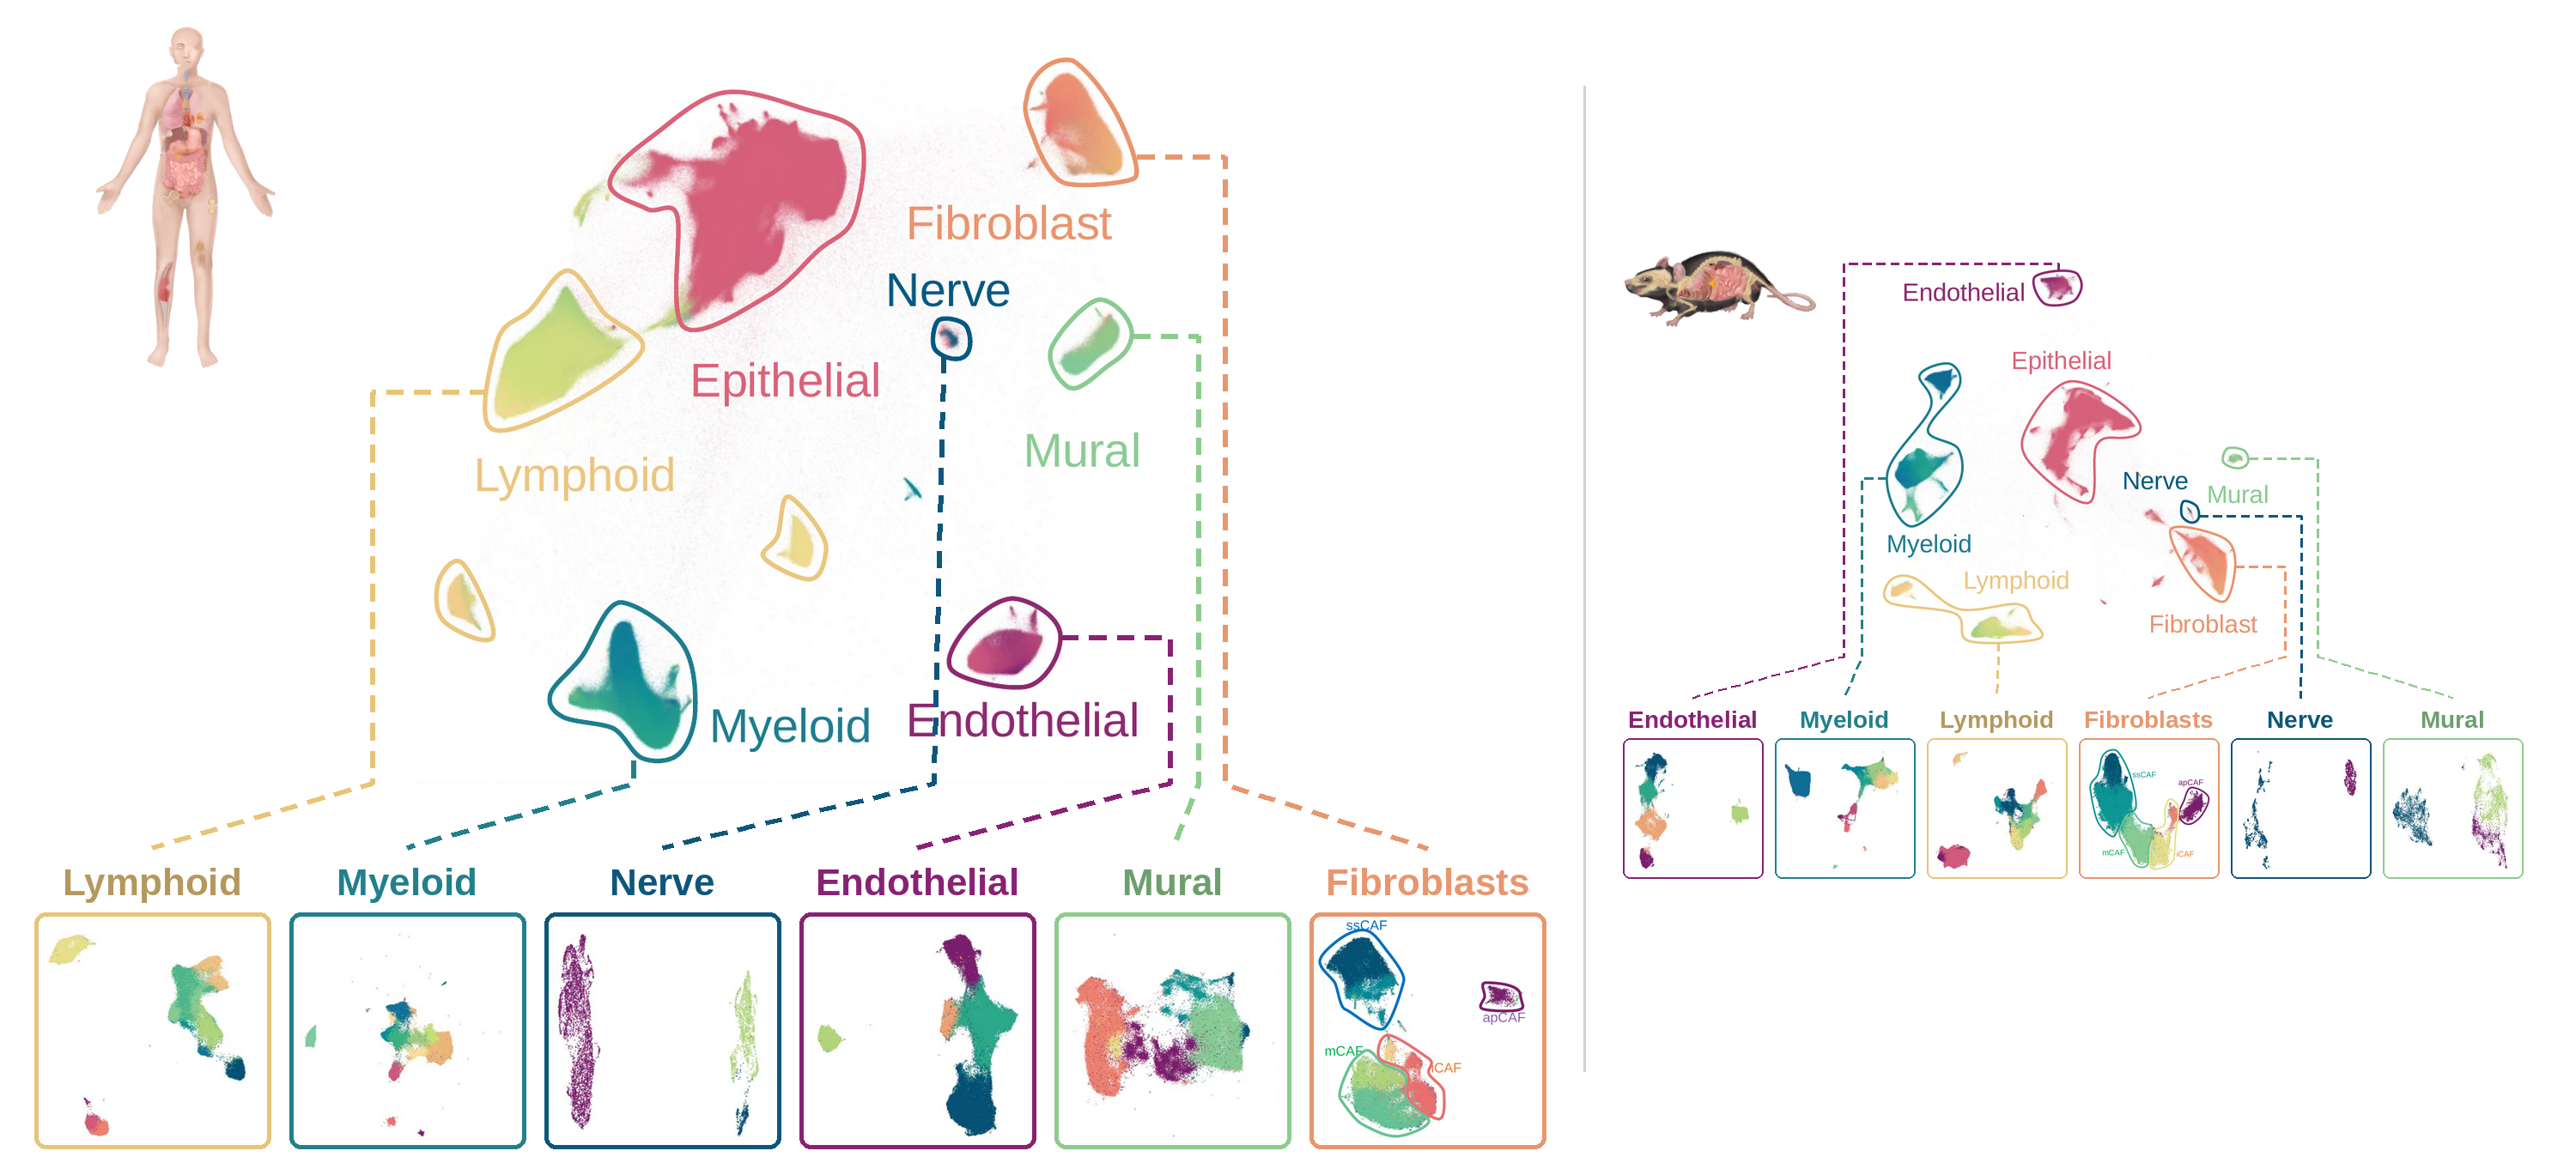
This site provides interactive visualization of a pan-cancer tumor microenvironment cell atlas with data from 15.4 million cells from 3,381 scRNA-seq tumor samples across 42 solid cancers. It is accompanied by the scTME R package, which annotates new scRNA-seq datasets with the atlas's consensus cell type nomenclature.
How to cite: Januszyk, M., Lu, J.M., Korah, M. et al. Conservation of the tumour microenvironment across organs and species. Nature (2026). https://doi.org/10.1038/s41586-026-11270-4
We welcome feedback via email at januszyk@stanford.edu.
© Stanford University 2026
About
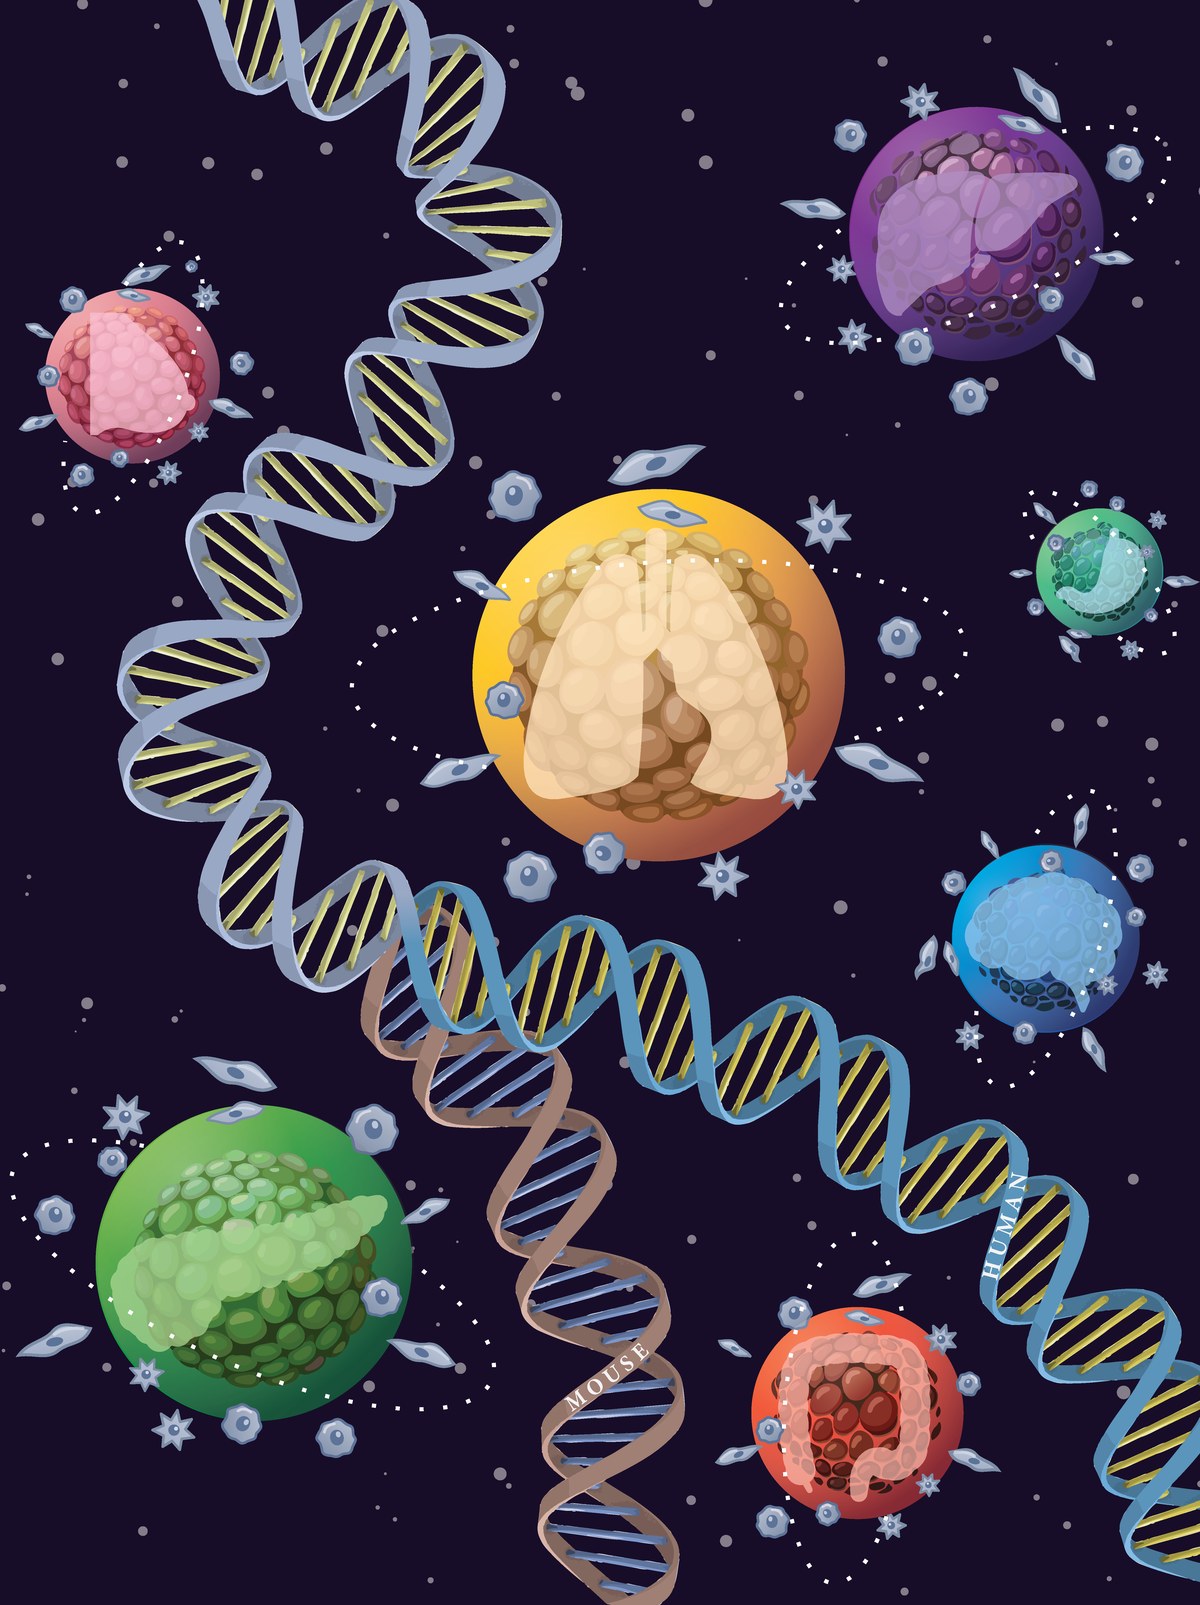
Overview of TMEAtlas
The tumor microenvironment (TME) plays pivotal but conflicting roles in disease progression and therapeutic response. Pan-cancer analysis of cells within the TME, including both the stromal and immune components, are needed to clarify these cell types’ roles given the breadth and diversity of human tumor pathology. In the article 'Conservation of the tumour microenvironment across organs and species' by Januszyk, M., Lu, J., et al., we curate the largest pan-cancer tumor microenvironment cell atlas to date with data from 15.4 million cells, 3,381 samples, and 258 datasets from human and mouse scRNA-seq tumor samples across 42 solid cancers. This TME atlas serves as an interactive web portal for users to independently interrogate these data. Further, this web atlas is accompanied by the scTME software package that will allow users to use our consensus cell type nomenclature to annotate new scRNA-seq datasets (scTME on GitHub).
Conservation of the tumour microenvironment across organs and species
Current understanding of the host tissue response to solid tumours is largely based on investigations of tumour types in isolation. Given the breadth and diversity of human tumour pathology and contributions of tumour microenvironment (TME) cells to disease progression, pan-cancer analysis is needed to bridge major themes of stromal and immune cell evolution. To date, however, efforts to compare the TME response across cancers have been limited in scope. Here we conduct a comprehensive pan-cancer analysis by algorithmically screening thousands of publicly available single-cell transcriptomic datasets for stromal and immune signatures across species and tissue types. We demonstrate conserved hallmarks of host cell transcriptional programming in response to malignancy across 42 cancer types in more than 2,000 human and mouse tumour samples. These findings are codified as an interactive web atlas (tmeatlas.stanford.edu) and software package (scTME) that will serve as practical resources for the systematic interrogation of the TME in tumours.
How to cite
Januszyk, M., Lu, J.M., Korah, M. et al. Conservation of the tumour microenvironment across organs and species. Nature (2026). https://doi.org/10.1038/s41586-026-11270-4
Human Overview
The Human Atlas is composed of 12.8 million cells from 2,855 samples from 190 scRNA-seq datasets of human solid-organ cancers. Cancer-associated fibroblasts (CAFs) are the predominant non-tumor stromal cell in the TME. Our analysis of 328,877 human CAFs resulted in the delineation of four transcriptionally distinct CAF populations: apCAFs, iCAFs, mCAFs, and ssCAFs. The conservation of CAF populations across tumor types suggests a conserved role for CAFs in solid organ tumors.

© Stanford University 2026
Human All Cells
For speed, these plots show a random subsample of the atlas (about 5,000 cells for most populations). The full datasets are available on the Download page.
For speed, these plots show a random subsample of the atlas (about 5,000 cells for most populations). The full datasets are available on the Download page.
Human Tumor Cancer Associated Fibroblasts
For speed, these plots show a random subsample of the atlas (about 5,000 cells for most populations). The full datasets are available on the Download page.
For speed, these plots show a random subsample of the atlas (about 5,000 cells for most populations). The full datasets are available on the Download page.
Human Tumor Endothelial Cells
For speed, these plots show a random subsample of the atlas (about 5,000 cells for most populations). The full datasets are available on the Download page.
For speed, these plots show a random subsample of the atlas (about 5,000 cells for most populations). The full datasets are available on the Download page.
Human Tumor Mural Cells
For speed, these plots show a random subsample of the atlas (about 5,000 cells for most populations). The full datasets are available on the Download page.
For speed, these plots show a random subsample of the atlas (about 5,000 cells for most populations). The full datasets are available on the Download page.
Human Tumor Lymphoid Cells
For speed, these plots show a random subsample of the atlas (about 5,000 cells for most populations). The full datasets are available on the Download page.
For speed, these plots show a random subsample of the atlas (about 5,000 cells for most populations). The full datasets are available on the Download page.
Human Tumor Myeloid Cells
For speed, these plots show a random subsample of the atlas (about 5,000 cells for most populations). The full datasets are available on the Download page.
For speed, these plots show a random subsample of the atlas (about 5,000 cells for most populations). The full datasets are available on the Download page.
Human Tumor Nerve Cells
For speed, these plots show a random subsample of the atlas (about 5,000 cells for most populations). The full datasets are available on the Download page.
For speed, these plots show a random subsample of the atlas (about 5,000 cells for most populations). The full datasets are available on the Download page.
Mouse Overview
Mouse Overview
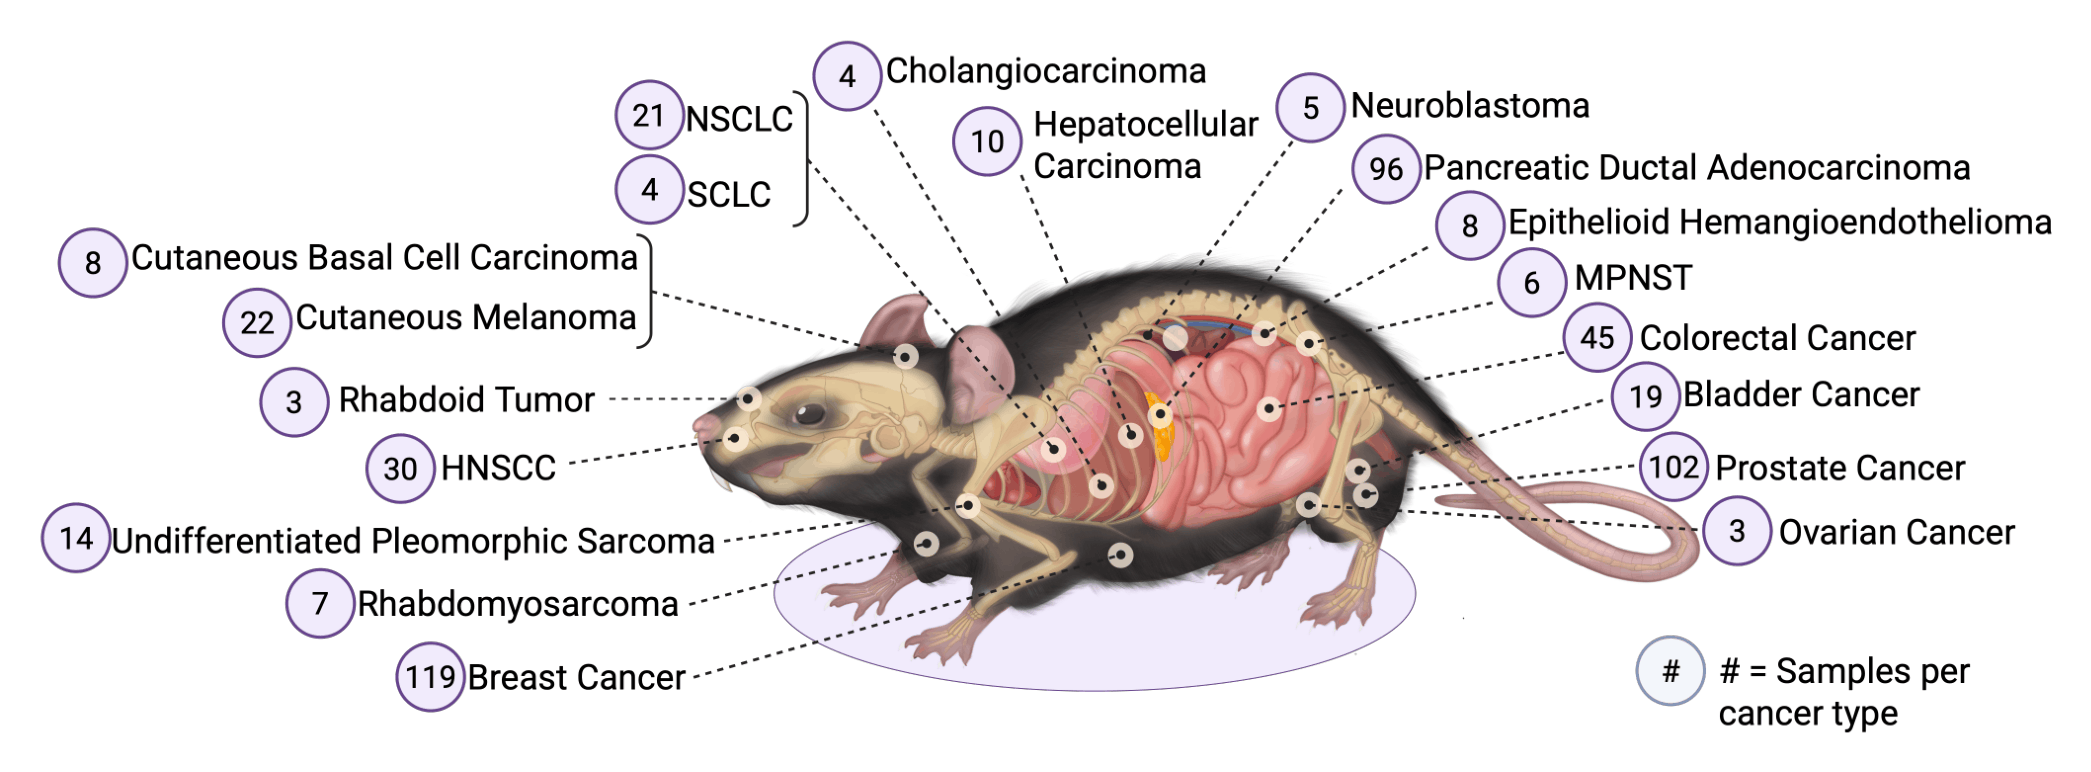
The Mouse Atlas is composed of 2.5 million cells from 526 samples from 68 scRNA-seq datasets of mouse solid-organ cancers. All tumors come from untreated genetically engineered mouse models (GEMMs) or orthotopic cancer cell line models. Our analysis of 225,361 mouse CAFs showed that, as in humans, they segregate into four transcriptionally distinct CAF populations: apCAFs, iCAFs, mCAFs, and ssCAFs. The conservation of these CAF populations across species supports the use of mouse models to study the human TME.
© Stanford University 2026
Mouse All Cells
For speed, these plots show a random subsample of the atlas (about 5,000 cells for most populations). The full datasets are available on the Download page.
For speed, these plots show a random subsample of the atlas (about 5,000 cells for most populations). The full datasets are available on the Download page.
Mouse Tumor Cancer Associated Fibroblasts
For speed, these plots show a random subsample of the atlas (about 5,000 cells for most populations). The full datasets are available on the Download page.
For speed, these plots show a random subsample of the atlas (about 5,000 cells for most populations). The full datasets are available on the Download page.
Mouse Tumor Endothelial Cells
For speed, these plots show a random subsample of the atlas (about 5,000 cells for most populations). The full datasets are available on the Download page.
For speed, these plots show a random subsample of the atlas (about 5,000 cells for most populations). The full datasets are available on the Download page.
Mouse Tumor Mural Cells
For speed, these plots show a random subsample of the atlas (about 5,000 cells for most populations). The full datasets are available on the Download page.
For speed, these plots show a random subsample of the atlas (about 5,000 cells for most populations). The full datasets are available on the Download page.
Mouse Tumor Lymphoid Cells
For speed, these plots show a random subsample of the atlas (about 5,000 cells for most populations). The full datasets are available on the Download page.
For speed, these plots show a random subsample of the atlas (about 5,000 cells for most populations). The full datasets are available on the Download page.
Mouse Tumor Myeloid Cells
For speed, these plots show a random subsample of the atlas (about 5,000 cells for most populations). The full datasets are available on the Download page.
For speed, these plots show a random subsample of the atlas (about 5,000 cells for most populations). The full datasets are available on the Download page.
Mouse Tumor Nerve Cells
For speed, these plots show a random subsample of the atlas (about 5,000 cells for most populations). The full datasets are available on the Download page.
For speed, these plots show a random subsample of the atlas (about 5,000 cells for most populations). The full datasets are available on the Download page.
scTME: Automated Tumor Microenvironment Annotation
Michael Januszyk — 2026-08-17
scTME transfers cell type annotations from a pan-cancer tumor
microenvironment atlas onto a new single-cell dataset. The atlas is
built into the package, so no reference needs to be supplied.
Annotations are available at two resolutions: 7 broad parent
populations, or 45 transcriptionally distinct subpopulations.
This vignette annotates a small public dataset and compares the results against that dataset’s own published labels.
Installation
scTME is installed from GitHub:
# install.packages("devtools")
devtools::install_github("michaeljanuszyk/scTME")
## Load Packages
library(Seurat)
library(SingleR)
library(SingleCellExperiment)
library(scTME)
The reference atlas and the query dataset
The reference atlas loads from the package itself:
data("scTME_atlas", package = "scTME")
The query is a heavily down-sampled (1,000 cell) subset of the Nieto 2021 immune cell atlas (A single-cell tumor immune atlas for precision oncology), which ships with the package:
query_path <- system.file("extdata", "nieto_2021_downsampled1k.rds", package = "scTME")
query_dataset <- readRDS(query_path)
The accompanying manuscript uses a larger 10,000-cell subset of the same dataset, which gives higher fidelity than the 1,000-cell subset used here, at the cost of runtime. The full Nieto 2021 dataset is linked on the Download page of https://tmeatlas.stanford.edu.
Note that this is a Seurat object. SingleCellExperiment objects can also
be passed to scTME.
names(query_dataset@meta.data)
## [1] "orig.ident"           "nCount_originalexp"   "nFeature_originalexp"
## [4] "metaNames"            "cancer"               "tissue"
## [7] "lv1_annot"            "lv2_annot"            "cluster"
The Nieto dataset carries two levels of its own annotations (lv1_annot
and lv2_annot), which are the final assignments made in that study. We
have also added a cluster column, which indexes the sorted order of
the lv2_annot values. Using it as the grouping variable means the
cluster-level examples below test label transfer given correct
groupings, rather than testing de novo clustering; the annotation itself
is still made without reference to the published labels.
table(query_dataset$lv1_annot)
##
##                  B cells    B cells proliferative      CD4 effector memory
##                       75                        3                       69
##         CD4 naive-memory   CD4 recently activated  CD4 transitional memory
##                       93                       45                       14
##            CD8 cytotoxic      CD8 effector memory        CD8 pre-exhausted
##                      131                       21                       15
## CD8 terminally exhausted                      cDC Macro. and mono. prolif.
##                       75                        4                        3
##         Macrophages SPP1               Mast cells                      mDC
##                       17                        5                       19
##                Monocytes                       NK                      pDC
##                       25                       45                        5
##           Plasma B cells            T cells naive    T cells proliferative
##                       21                       81                       41
##       T cells regulatory           T helper cells                TAMs C1QC
##                       65                       33                       72
##      TAMs proinflamatory
##                       23
table(query_dataset$lv2_annot)
##
##            B cells activated               B cells memory
##                            5                           35
##                B cells naive        B cells proliferative
##                            3                            3
##    B cells unswitched memory                CD4 activated
##                           31                           26
##       CD4 effector memory RA        CD4 memory stem cells
##                           64                          165
## CD4 resident effector memory      CD4 transitional memory
##                           67                           27
##                CD8 activated                CD8 cytotoxic
##                           17                          104
##                CD8 exhausted            CD8 IFN activated
##                           98                            1
##                          DC1                    DC2 CD1C+
##                            1                           21
##                    DC3 LAMP3                    DC4 CD1C-
##                            3                            8
##     Macro. and mono. prolif.           Macrophages CXCL10
##                            5                            1
##             Macrophages SPP1                   Mast cells
##                           13                            1
## Monocytes tumor infiltrating                           NK
##                           31                           66
##                          pDC               Plasma B cells
##                            5                           20
##        T cells proliferative           T cells regulatory
##                           40                           54
##                T helper/Th17                    TAMs C1QC
##                            6                           79
table(query_dataset$cluster)
##
##   1  10  11  12  13  14  15  16  17  18  19   2  20  21  22  23  24  25  26  28
##   5  27  17 104  98   1   1  21   3   8   5  35   1  13   1  31  66   5  20  40
##  29   3  30  31   4   5   6   7   8   9
##  54   3   6  79   3  31  26  64 165  67
Run scTME on the query dataset
Now we can go ahead and run scTME. This function accepts up to 7
parameters:
obj: The Seurat or SingleCellExperiment query dataset on which to run the predictions.ref: (Default:NULL) The reference object powering scTME (scTME_atlas). If left asNULL, the package’s built-in reference atlas will load automatically.clusters: (Default:NULL) IfNULL, the function evaluates each cell independently. Alternatively, provide a character array or column name labeling the groups/clusters in the query dataset (e.g.,query_dataset$clusteror"cluster") to run faster, cluster-level predictions.level: (Default:2) Evaluates the query against all 45 high-resolution subpopulations. It can optionally be set to1to evaluate against the 7 broader parent populations.label.col: (Default:NULL) The specific metadata column in the reference object containing the cell type labels. IfNULL, the function automatically selects the correct column based on your chosenlevel.max.cells: (Default:50000) To improve runtime, this value automatically downsamples the query dataset if it exceeds this threshold.return.details: (Default:FALSE) By default,scTMEreturns a vector of the most likely cell type predictions. If set toTRUE, the program returns a full list object containing additional prediction strength and confidence metrics.
Note that the query downsampling controlled by max.cells is random.
Call set.seed() beforehand if you need a reproducible result.
Broad populations, cluster-level
res = scTME( obj = query_dataset, ref = NULL, clusters = query_dataset$cluster, level=1, return.details = F )
## No reference provided. Loading built-in scTME atlas...

## Log-normalizing reference object...

## Warning: Layer 'scale.data' is empty
query_dataset$prediction <- unname(res)
We can now compare these predictions against those originally assigned
by Nieto. scTME_generateHeatmap() cross-tabulates the two, coloring by
row proportion and printing the raw cell counts.
scTME_generateHeatmap(query_dataset,
                      pred_col  = "prediction",
                      annot_col = "lv1_annot")

Cluster-level agreement between scTME broad-population predictions and the published labels
Subpopulations, cluster-level
Level 2 gives more precise predictions for each query_dataset$cluster.
res = scTME( query_dataset, ref=NULL, clusters = query_dataset$cluster, level=2, return.details = F )
## No reference provided. Loading built-in scTME atlas...

## Log-normalizing reference object...

## Warning: Layer 'scale.data' is empty
query_dataset$prediction = unname(res)
scTME_generateHeatmap(query_dataset,
                      pred_col  = "prediction",
                      annot_col = "lv2_annot")

Cluster-level agreement for the 45 subpopulations
Subpopulations, cell-level
Setting clusters = NULL annotates each cell independently. This is
slower and noisier than the cluster-level call above, but requires no
prior grouping of the query dataset.
res = scTME( query_dataset, ref=NULL, clusters = NULL, level=2, return.details = F )
## No reference provided. Loading built-in scTME atlas...

## Log-normalizing reference object...

## Warning: Layer 'scale.data' is empty
query_dataset$prediction = unname(res)
scTME_generateHeatmap(query_dataset,
                      pred_col  = "prediction",
                      annot_col = "lv2_annot")

Cell-level agreement for the 45 subpopulations
Visualize Predictions on UMAP
To see how the predicted cell types map onto the transcriptomic
landscape, we can visualize the cells in reduced dimensional space.
Here, we project both the original high-resolution annotations and the
new scTME predictions onto the UMAP embeddings using our custom
plotting wrapper.
# Plot the original annotations using the safe wrapper
plot_true <- plotPredictionUmap(query_dataset, reduction = "umap", pred_col = "lv2_annot")

# Plot the scTME predictions using the safe wrapper
plot_pred <- plotPredictionUmap(query_dataset, reduction = "umap", pred_col = "prediction")

# Only attempt to modify and combine the plots if the UMAP actually exists
if (!is.null(plot_true) && !is.null(plot_pred) &&
    requireNamespace("patchwork", quietly = TRUE)) {

  library(patchwork)

  # Override the default titles and remove legends for clean patchwork display
  plot_true <- plot_true + ggplot2::ggtitle("True Annotations") + Seurat::NoLegend()
  plot_pred <- plot_pred + ggplot2::ggtitle("scTME Predictions") + Seurat::NoLegend()

  # Display side-by-side
  plot_true + plot_pred

} else {
  message("Skipping UMAP visualization because the 'umap' reduction is missing from the object.")
}

UMAP of the query dataset colored by published labels (left) and scTME predictions (right)
Atlas data and Nieto dataset
The scTME reference atlas is included with the R package and loads automatically when ref = NULL. No separate reference download is needed.
Full human tumor microenvironment atlas
12.86 million cells; about 27 GB to download. Raw counts in split archive parts, cell metadata, and Harmony/UMAP embeddings.
Open human atlas files on ZenodoHuman file list and reassembly instructions
Full mouse tumor microenvironment atlas
2.55 million cells; about 6.6 GB to download. Compressed raw counts, cell metadata, and Harmony/UMAP embeddings.
Open mouse atlas files on ZenodoNieto et al. 2021 Tumor Immune Cell Atlas
Access the original Nieto et al. 2021 dataset on Zenodo.
Open Nieto 2021 dataset on Zenodo